I was listening to the first period of the Flyers’ latest game against Buffalo on my drive home. When the Sabres scored three goals in 5:17 of game action on the way to a four-goal opening period, I shook my head and let out a sigh.
To me, and other Flyers fans, slow starts to games have felt like an issue for this team for nearly as long as its epic ongoing goaltending saga. Yet somehow the beginnings of games this season have felt even more punchless.
Wednesday night was the latest example. The Flyers entered the 1st intermission staring at a 4-0 deficit. To their credit: the Orange and Black fought back in the 2nd period, finding the back of the net twice and nearly doing so on several more occasions.
The Sabres would go on to bury the puck into an empty net in the final frame, giving them a deserved 5-2 victory.
After the issue-filled opening period, I got curious about whether myself (and others) were simply just feeling like the Flyers are having more difficulty scoring in the 1st period this year, or whether there is some actual basis to that observation/complaint.
The Process
I started with a glance at the team’s goals by period table. Philadelphia’s opponents have outscored them in all three periods this year.
Before playing Buffalo, opponents scored 17 goals to the Flyers’ 16 in 1st periods through 20 games. In the 2nd period, it’s a 26-22 margin in favor of the other team. It’s nearly identical in the 3rd period, with the Flyers putting up 23 goals but giving up 26.
Admittedly: 20 games is a small sample size to form the basis of a claim like ‘They always start slow.’
The Hakstol Era
So I broadened out the timeframe from which to pull the data from. I focused on Dave Hakstol’s time as head coach of the Flyers, which dates back to the 2015-16 season. Including this season, we have roughly 3.25 seasons (266 games) worth of scoring information to work with. For what it’s worth: I excluded Vegas from all rankings since they’ve only existed for 1.25 seasons.
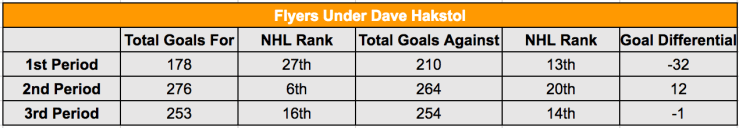
That first row grabs your attention, right?
Not only is the Flyers’ 1st period offense among the four worst in the National Hockey League since 2015-16, their -32 goal differential is also among the bottom-five. The other teams joining them? Vancouver (-47), Los Angeles (-43), Colorado (-41) and Detroit (-35).
However Philadelphia does deserve praise for being either elite, or average in four of those six categories (particularly their second period scoring). But that offensive output in the 1st period and the defense in the 2nd appear troubling.
To truly comprehend whether those are just “blips” under Hakstol, or whether these issues have been going on longer — we need to go back a few years.
Before Hakstol
In order to somewhat fairly compare the current numbers to those in the past, we will look at the Flyers teams from 2011-12 – 2014-15. That stretch gives us three full seasons, and a lockout-shortened season in 2012-13. For a “total games” comparison: this pre-Hakstol window includes 294 games played, while Hakstol has coached 266 games (not including the loss in Buffalo).

The offensive numbers and ranks in respect to the rest of the league are obviously are much higher than those with Hakstol at the helm. However, the defensive results are worse.
It’s worth noting that the goal differentials in each period (specifically the 1st) are also much different.
Before you go pointing to the fact that this “pre-Hakstol” sample included more games, ponder this: Hakstol would need to coach 28 more games in Philadelphia to equal that window. However his teams had fared 25-goals worse (based on differentials) than the clubs before he took the reigns. If you factor in the four-goal salvo the Sabres fired at the Flyers Wednesday night, then you realize the Flyers would need to outscore their next 27 opponents by a total of 29 goals in 1st periods just to equal the same -7 mark from the previous 3.5 seasons.
Comparing The Two Eras
If you’re more of a visual person (like I am), then we can also turn to an admittedly basic version of a rate statistic to even out the games played disparity: Goals per 60 minutes played. It’s a common way to try to compare individual players while accounting for differences in ice time.
For our purposes, the calculation is pretty simple since we’re using hard numbers like goal and game totals. Every period is 20 minutes. There are three of them each game (60 total minutes). We already have both goals scored and allowed broken down by period.
For example: before the Buffalo game on Nov. 21st, Hakstol had coached 266 games. That’s 266 1st periods, 266 2nd periods, etc. So it’s a simple case of dividing goals in a period by the number of periods played (266) and then multiplying that result by three (to get 60 minutes).
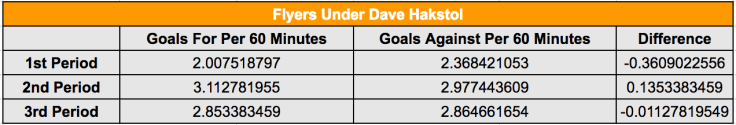
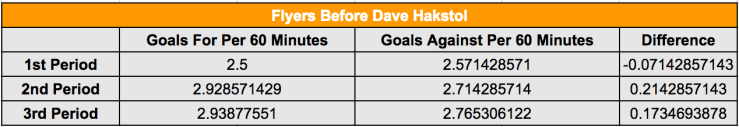
Before hiring Dave Hakstol, the Flyers scored 2.5 goals for every three 1st periods they played. Under Hakstol’s watchful eyes, that’s dropped to 2.00. We also see the same 2nd period scoring increase (more than a full goal per 60 minutes better than the 1st period), as well as the defensive changes both positive and negative that we noted above.
But that’s also a lot of decimal places and long numbers, and in reality goals don’t come in fractions. So we’re going to, essentially, flip Goals per 60 on its head and instead look at it by minutes per goal scored. It’s basically like taking an average to find out roughly how many minutes of play in each period (1st, 2nd, 3rd) it’s taking the team to score one goal. The lower the number, the faster/more frequently they score (and negative differentials would, theoretically, be good).
Example: Hakstol has overseen 266 1st periods with the Flyers (since he’s coached 266 games). We multiply that by 20 (minutes per period) to get the total number of 1st period minutes, and divide that total by the total number of 1st period goals.
It’s flawed, which we’ll explain why below, but it’s also a little cleaner and easier to process (since the entire point of hockey is to score a goal, and those don’t come in fractions).
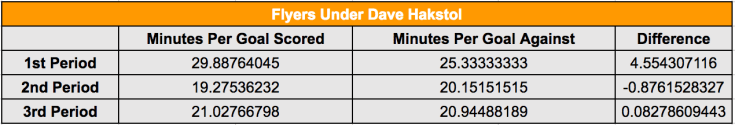
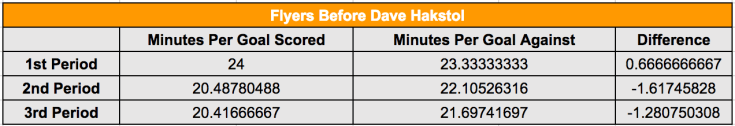
That helps clear things up a bit.
So while, yes, the Flyers 1st period defense under Hakstol has improved by forcing opponents to take an average of two minutes longer to score, their offense is taking nearly six minutes longer to score.
The opposite came true in the 2nd period, while both the offensive and defensive rates in the 3rd got worse with Hakstol at the helm.
Flaws With This Exercise
I’ll be the first to admit that this is far from a complete analysis of the Flyers first period woes in recent history.
It views every goal as the same (which is true on the scoreboard and box score), but in actuality not all goals are of equal quality due to a variety of factors (shot location & quality, pass before the shot, screens, deflections, etc.). This view also doesn’t highlight the difference between a barrage of 1st period goals, and four games without one.
The minutes per goal scored model also has issues, since it essentially averages things out. We also are viewing each period essentially in a vacuum, which doesn’t happen in hockey. A team or player’s effort can bleed over from one period to another, and one game to the next. Something a winger did in the 1st period may have directly set-up his goal in the 2nd.
This also does not include metrics that measure shot attempts (Corsi) or those that weight those shots based on their quality and location (xG — expected goals). Although based on Corsica.Hockey’s xG model, the Flyers have actually been under-performing in terms of goal scoring in the Hakstol era after over-performing on that end from 2011-12 – 2014-15.

The game of hockey has also changed, even in the five years from 2011-12 to 2016-17 that bridge our ‘eras,’ to become more speed and offensively oriented.
Are there roster and player differences between those two Flyers eras? Absolutely. Does goaltending play a role that doesn’t get factored into this exercise? 100%. Do the players have some responsibility? You bet.
Like I said. This is an imperfect look at it, since hockey is part art and part science. There are a million different lenses and microscopes through which to look at various parts of the game.
Takeaways
However, with those flaws in mind, it also proves an issue from the Peter Laviolette & Craig Berube days still exists now — and in some cases, got worse.
Moreover it shows that while the 1st period has been the worst for the Flyers offensively & defensively since 2011-12, Philadelphia’s offensive struggles in the opening frame have gotten so much worse under Hakstol that any defensive gains the club has made cannot make up that gap.
The Flyers are a flawed club. There’s no two ways around it. Between the carousel in the crease, and the special teams (featuring a PK unit that’s on pace to be tied for the 2nd worst the NHL has ever seen) — this franchise has several things to fix.
Finding a way to consistently generate offense after the opening puck drop now needs to be added onto that ‘to-do list’ if this team is going to meet its own preseason goal of raising the bar, and getting beyond the first round of the playoffs.
Fittingly the last time they did so was the start of our ‘pre-Hakstol’ era — 2011-12.
If you have any questions or feedback: leave a comment, send me an email at the address on the bottom of the page or hit me up on Twitter (@ScottMalone91).
